Drawing torus knots by gnuplot
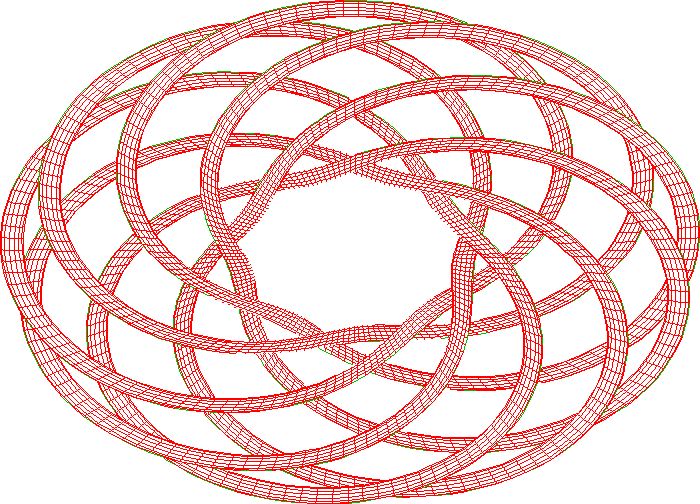
Computer users who love topology tend to draw torus knots. You may find many examples on the web. The following is the (7,9)-torus knot drawn by gnuplot.

For example, input the following lines:
p=7; q=9
set term x11
set parametric
set urange [0:2*pi]
set vrange [0:2*pi]
set zrange [-1:1]
unset tics
unset border
set hidden3d
r=1; s=0.5; t=0.05
set isosamples 15*p*q, 15
splot (r+s*cos(q*u)+t*cos(v))*cos(p*u), \
(r+s*cos(q*u)+t*cos(v))*sin(p*u), \
s*sin(q*u)+t*sin(v) title ''
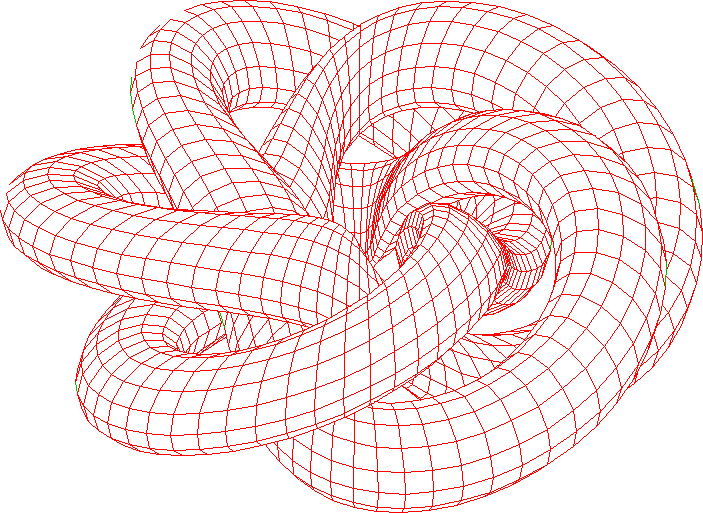
Change the values p, q if you want other torus knots. And adjust the values r, s, t as you like. For example, set p=3, q=5, and t=0.3, you obtain the next figure.

You can rotate the figure by the mouse action. To create image file, e.g. png file, input the following lines:
set term png size 1280,960 crop
set output "torusknot.png"
replot
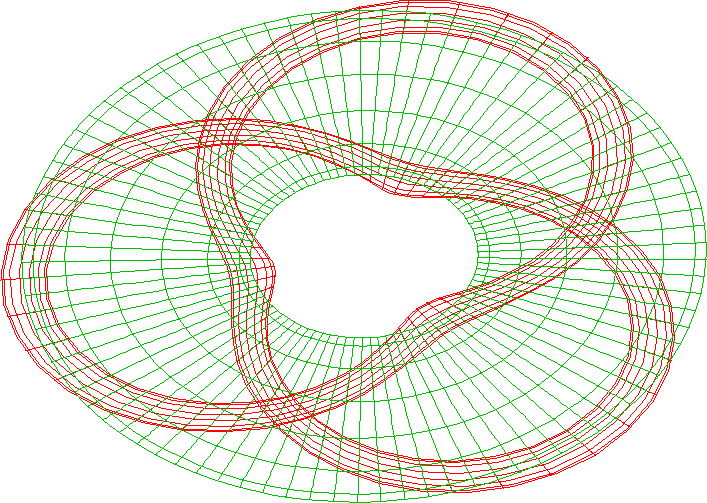
You can add a big torus surrounded by the knot.

p=2; q=3
set term x11
set parametric
set urange [0:2*pi]
set vrange [0:2*pi]
set zrange [-1:1]
unset tics
unset border
r=1; s=0.5; t=0.1
set isosamples 15*p*q, 15
splot (r+s*cos(q*u)+t*cos(v))*cos(p*u), \
(r+s*cos(q*u)+t*cos(v))*sin(p*u), \
s*sin(q*u)+t*sin(v) title ''
rep (r+s*cos(v))*cos(u), (r+s*cos(v))*sin(u), s*sin(v) title ''